
The advertising dashboard provides you with a quick overview of your daily use.
This article explains how to manage your advertising dashboard to give you quick access to your campaign statistics without having to open up all other pages.
The advertising dashboard contains a couple of widgets that allow you to quickly assess your advertising campaigns:
- View your total impressions, clicks generated by your ad campaigns.
- See how much you pay for your ad campaigns.
- Understand which campaigns, countries and operating systems perform on your ad campaigns.
- You can identify the areas that require special attention in a blink.
This article explains how to view your advertising dashboard data.
Working with Advertising Dashboard
Instructions
Sign in to your EroAdvertisings account.
Your advertising dashboard data page appears and contains the cumulative data for your ad campaigns. Use this data to understand how your advertising campaigns are performing over time and analyze trends. You can hover over the graph to see more information on your ad campaigns.
Note: Too few data means that your data are not statistically significant or not shown.
Contents of dashboard
- Widget 1 – Campaign statistics and the remaining balance.

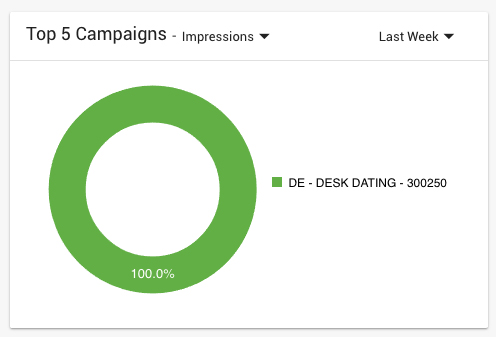
- Widget 2 – What are your Top 5 Campaigns?
Here you will see which individual Advertising Campaigns that are pulling in impressions, clicks and how much you paid for that traffic.
The “Impressions” metric shows you the total impressions generated by each individual Advertising campaign, the “Clicks” metric shows you the total clicks. The “Paid” metric shows you the amount of money paid for your campaigns. A filter has been set up to see last week or this week’s data.
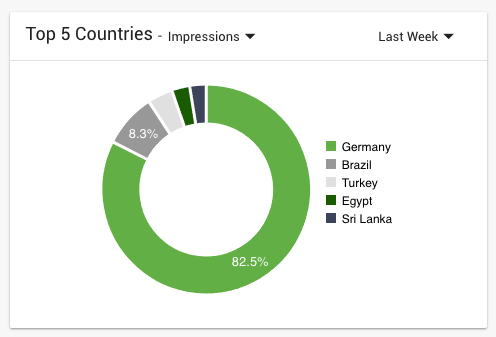
- Widget 3 – What are your Top 5 Countries?
Here you will see which individual Countries that are pulling in impressions, clicks and how much you paid for that targeting traffic.
The “Impressions” metric shows you the total impressions generated by each individual Country, the “Clicks” metric shows you the total clicks. The “Paid” metric shows you the amount of money paid for the Countries. A filter has been set up to see last week or this week’s data.
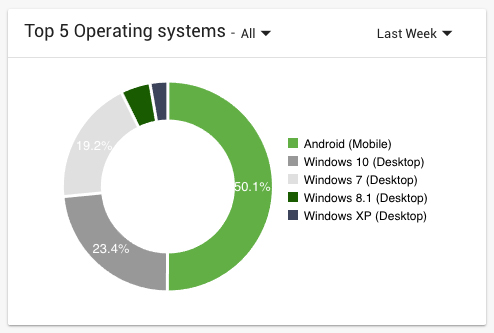
- Widget 4 – What are your Top 5 Operating Systems?
Here you will see which individual Operating System that is pulling by the device.
The “All” metric shows you all devices generated by each individual Operating System, the “Desktop” metric shows you all desktop Operating Systems, the “Mobile” metric shows you all mobile Operating Systems and the “IPTV/Console” metric shows you all IPTV Operating Systems. A filter has been set up to see last week or this week’s data.
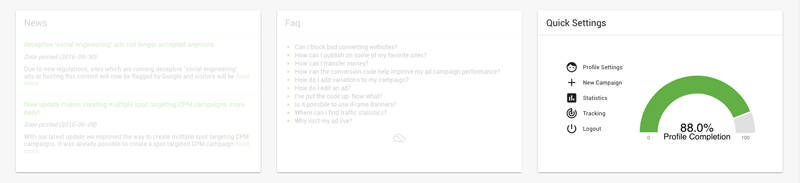
- Widget 5 – News
It will usually show the latest news/updates of our System, here you can find something we think it’s important for you to know, including network-related failures;
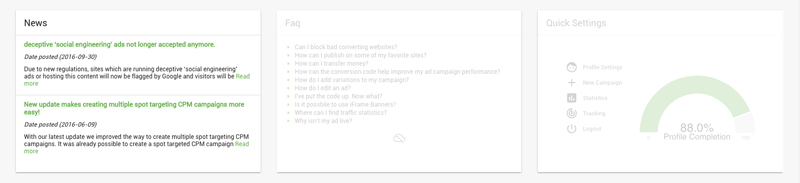
- Widget 6 – FAQ
It will usually show the most Frequently Asked Questions from our knowledge base, where you can find all the answers to your questions.
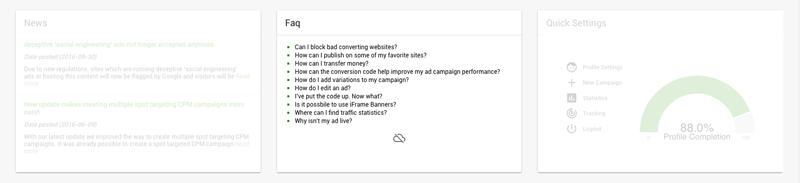
- Widget 7 – Quick settings
It will usually show links to frequently used User Panel items.
You can view your advertising dashboard at any time.
Have additional questions? Reach out to our friendly support team at support@eroadvertising.com


